
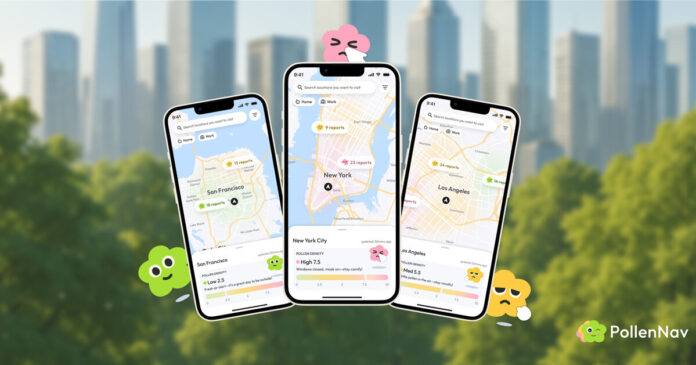
PollenNav navigation app maps lower-pollen routes in the city
Most navigation apps optimize for time, distance, or traffic. PollenNav asks a different question: which route will least likely leave you struggling to breathe? Designed by Bay Area product designer Yani Shi with collaborators Yawen Zheng, Ziqi Li, and Chang Mou, the app treats pollen exposure as a routing variable, as real to an allergy sufferer as a road closure is to a driver. The premise is personal. Shi spent a stretch of 2021 dismissing her own allergy symptoms until they escalated into asthma, coughing through nights she couldn’t sleep. The recurring thought during that period — that she simply had no way of knowing where the allergens were — became the project’s starting point.
Roughly a billion people worldwide share some version of that blind spot, navigating cities with tools that account for everything except the air. Where conventional pollen forecasts stop at a single city-wide number, PollenNav works at the scale people actually move through: the block. It merges official readings from the National Weather Service with symptom reports submitted by users on the ground, cross-checking the two so the map reflects conditions as they are, not as a regional average predicts.

PollenNav | all images ©Yani Shi
personalized pollen data and playful graphics map allergy risk
An onboarding questionnaire tunes everything to the individual; someone reactive to grass and someone reactive to birch see the same street rendered differently. That data surfaces as a color-graded map, red through green, but the app’s more deliberate choice is how it handles tone. Health information about your own body is easy to make anxious; PollenNav instead assigns pollen levels to a set of flower characters whose expressions shift with the risk, so the interface reads as approachable rather than clinical. Paired with an Apple Watch, the system notices repeated sneezing and offers a one-tap way to log it, feeding the same community map the user relies on. A points system rewards those reports, which in turn sharpen the model’s read on which allergens dominate a given area.
The work has been recognized with the iF Design Award 2026, the Red Dot Award: Brands & Communication Design, a Silver at the New York Product Design Award, and the European Product Design Award. Yani Shi is a product designer at Lyft, where she leads experience design for the Verticals team across airport, scheduled-ride, and large-event transportation; she studied at UC Berkeley (M.Design) and previously worked at AKQA and Baidu, and sits on the jury for several international design awards. For her, PollenNav is less a health product than an argument about what navigation should be responsible for, the idea that a map might reasonably be expected to know something about the person reading it.

each year, more than 1 billion people in the world suffer from pollen allergies

enter your allergens

check pollen levels before visiting

get personalized pollen report

plan your trip to dodge pollen

report pollen, earn rewards

get notified across devices
